
(Case study sourced from Better Buildings Partnership UK)
Situation
In most large commercial buildings, the internal environment is managed by a climate control system, otherwise known as a Heating, Ventilation and Air Conditioning (HVAC) system. This typically includes boilers, chillers and air handling units, controlled and monitored by a BMS. Plant is typically responding to hundreds of smaller devices, such as fan coil units, asking for hot or cold water or air.
It can be time consuming to identify faulty or incorrectly set devices, which may be affecting comfort levels for building users and resulting in wasted energy. Finding information to optimise building performance in a BMS can be like finding a needle in a haystack. Busy facilities management teams can default to responding reactively to occupier complaints, rather than proactively managing efficiency.
In 2013, Demand Logic launched a system that monitors thousands of HVAC and meter data points and finds the ones making excessive demands on the plant, causing comfort problems and wasting energy. A device fitted to the BMS sends data to Demand Logic’s cloud service, where software analyses it, producing live graphics and tables of equipment and building performance. Building managers can log on to see these graphics via a social media platform, sort information in tables, chat about the action required and take maintenance action to address anomalies.
Actions
BBP members have installed Demand Logic across buildings of different ages, sizes and uses.
Canary Wharf Group awarded Demand Logic a £50,000 Cognicity Challenge prize and the opportunity to implement its technology at Canary Wharf in 2015, as part of its smart cities accelerator programme for new technologies.
The installation and pilot of Demand Logic’s technology in 25 Churchill Place, a 50,630m² office building, identified annual energy efficiency savings in excess of £100,000 and improved temperature control, providing better comfort levels for building users.
Fig. 1: These Comfort Tracker graphics for 25 Churchill Place show improvements in temperature management between September 2015 and January 2016, with fewer spaces too hot (red) or cold (blue) and more spaces with well-controlled temperatures (central band).
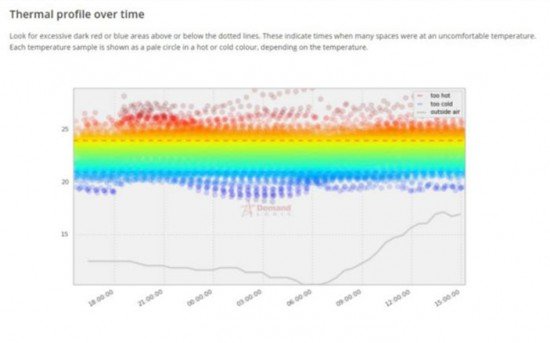
September 2015
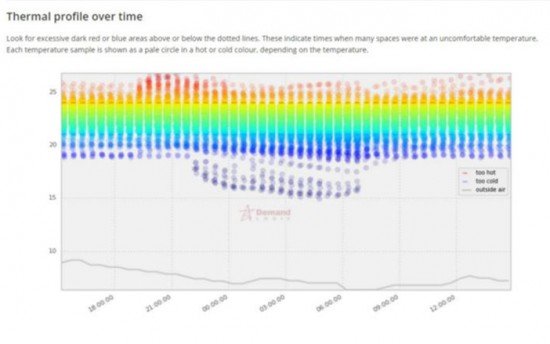
January 2016
Land Securities uses Demand Logic across more than 232,200 m² of office, retail and other space, after a successful pilot at Dashwood House, a 14,770m² office building, contributed to around £100,000 of savings in the first year.
Fig. 2: This Major Plant Watchdog graphic for Dashwood House highlighted air handling units, chillers and boilers running out of hours (red), which the building team investigated and resolved.

At 20 Fenchurch Street, a 63,900m² joint venture development with Canary Wharf Group, Land Securities installed Demand Logic during fit-out commissioning, monitoring 175,000 data points in real time. This enabled the team to resolve issues more quickly, not only for the base building but also the fit-out works. For instance, when one occupier was experiencing problems during fit-out, the Demand Logic graphics showed clearly where there were spikes in consumption on their floor, which enabled the occupier’s fit-out team to focus quickly on rectifying the issue.
M&G Real Estate uses Demand Logic with CBRE at 3 Temple Quay a 13,720m2 office building, with more buildings being considered. 49 energy saving opportunities were identified in the first six months and those already implemented are delivering annual savings of £19,400 and cutting CO2 emissions by 260 tonnes, with further initiatives in the pipeline.
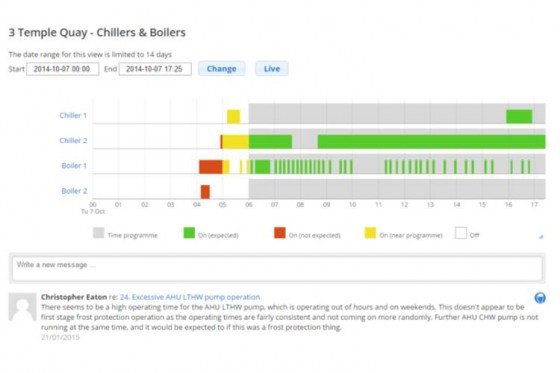
Fig. 3: This Major Plant Watchdog graphic for 3 Temple Quay identified boilers and chillers running at the same time (green) and boilers running out of hours (red), which the building team investigated and resolved.
TH Real Estate used Demand Logic during the commissioning of The Steward Building, a 4,500m2 office development, to analyse 25,000 data points. 70 actions were flagged, with 45 resolved before practical completion and others further investigated, improving the commissioning process. Specific issues were identified on 20% of 136 chilled beams. Working with property manager Cushman & Wakefield, Demand Logic is now used in other TH Real Estate buildings, including 133 Houndsditch (18,580m2), where savings of up to £50,000 have been identified.
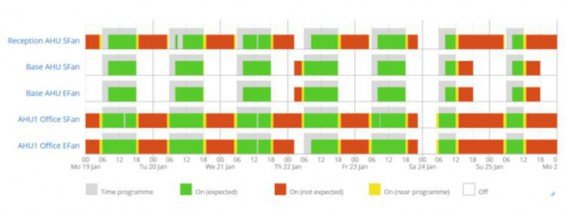
Fig. 4: This Major Plant Watchdog graphic for The Steward Building flagged air handling units running out of hours (red), which the building team investigated and resolved.
The Crown Estate is piloting the system with Regent Street Management Direct at 1 Vine Street (10,260m2) in 2016. To progress opportunities highlighted through the Demand Logic system, the team established roles from diagnostic through to resolution.You can download the Workflow Graphic here, as well as at the bottom of the page.
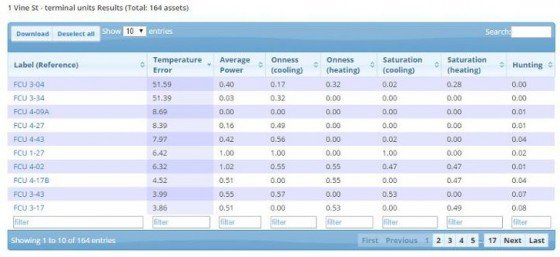
Fig. 5: This Demand Logic table for 1 Vine Street highlighted temperature errors on fan coil units, which the building team investigated and resolved.
Transport for London uses Demand Logic across 98,000 m2 of office space. The system has helped improve interaction between engineering managers and service providers, as well as identifying faulty equipment, heating and cooling systems running out of hours and space being heated and cooled at the same time. Analysis from Demand Logic, immediacy of communications and user-friendly visualisation tools have made a real difference to building operations.
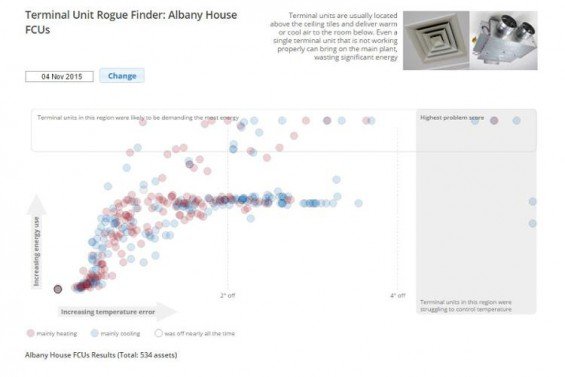
Fig. 6: This Demand Logic Rogue Finder graphic for Albany House identified individual faulty fan coil units making plant run unnecessarily; which the building team investigated and fixed, saving them time checking units in difficult to access areas.
Financials
- Annual subscription, which includes installation, access to the online platform, remote support from Demand Logic’s engineers and reviews of progress on actions.
- Average energy cost savings: 10%-30%.
- Average payback: within nine months.
- Helping deliver £1.8 million energy cost savings annually for BBP members and occupiers.
Benefits for BBP members
Maximising the use of BMS data which has helped:
- Improve comfort levels for building users, proactively managing temperatures, lighting and air quality, e.g. reducing likely hot and cold spots.
- Enable building teams to track down malfunctioning equipment quickly, saving time and money on maintenance, particularly for equipment in difficult to access areas, as well as extending plant lifespans and transitioning to condition-based maintenance that can both improve comfort levels and efficiency.
- Support and streamline the commissioning process, validating that equipment has been correctly installed and configured through automatic fault detection.
- Provide a user-friendly social media interface for building teams, making data immediately accessible in a familiar format, including a table view that allows a rapid overview of many devices and filtering for conditions.
- Save 11,800 tonnes of CO2 each year.